Concepts · For everyone
How Accurate Is a Stockpile Measurement? Reading the ± Range and the Five Things That Move It
Every stockpile volume is an estimate with an error bar, whether or not anyone printed it. Here is what the bar means, what makes it wider, and how to narrow it.
In short
- A ± range is a statement about one measurement of one pile, not a brand promise. ≈12.1 yd³ ±2.0 means the surface and scale support a volume between about 10 and 14 yd³.
- Five things move a stockpile volume: the base surface, the toe, coverage and scale, density, and timing. The base alone can swing a volume more than the choice of method.
- Published drone studies land within 0–3% of laser-scanned truth; a state DOT found a phone app within about 1.5%. Tape-and-cone estimates run 15–30%.
- When two surveys of the same pile disagree, check which base and toe each one used before blaming the instrument.
What a ± range actually tells you
A result like ≈12.1 yd³ ±2.0 is a statement about one measurement of one pile on one day. It says the surface, the border and the scale behind that number support a volume somewhere between about 10 and 14 cubic yards. It is not a specification for the instrument or a promise about the next pile. A different pile, walked in worse light with the loop not quite closed, would come with a wider range.
In Stockpile Scan the range is worked out from the scan itself: how well the walk closed, how confident the scale is (tighter with LiDAR, looser from motion tracking alone), how noisy the surface came out, and how the border sits on the toe. Plain-language checks sit next to it, such as a walk that didn’t go all the way around. The weight estimate inherits the whole range and adds the uncertainty of whatever density you chose. Tape-and-formula estimates have an error bar too; nobody prints it, and it is usually 15–30%.
1. The base surface under the pile
The volume of a pile is the space between its top surface and the ground beneath it, and the ground is the part nobody can see. When a quarry’s survey disagrees with its production records, the people who do these surveys for a living point at the base first. LiDAR Magazine calls the base definition the primary culprit and lays out three ways to handle it: use the true ground surface at the time of the scan; use the pile’s toes for the edge but take the base geometry from an earlier baseline survey; or build the base from the baseline and use the toes only to place it. Each gives a different number for the same pile, and all three are defensible if everyone agrees in advance.
At a smaller scale the same thing happens when a pile sits on a slope, on a crowned pad or on last season’s leftovers. Decide what the base is, write it down, and use the same choice next time.
2. The toe and the footprint
The toe is where the pile meets the ground, and the line of toes is the footprint. Automatic toe detection in survey software fails when points near the base are sparse or noisy, which is why GeoCue’s guidance on defining stockpile toes exists. Material spread thin at the edge, a loader rut, or a second pile touching the first all make the footprint ambiguous. In a phone scan the fix is to drag the border until it encloses exactly the pile you mean; the volume updates as you go.
3. Coverage and scale
A measured surface is only as complete as the capture. Walking all the way around and a little past the start, keeping the whole pile in frame, is what lets photogrammetry close the loop and distribute any drift evenly instead of leaving a seam. Tall piles are the hard case from the ground: a sensor at the toe cannot see the top, so you stand farther back or accept a wider range.
Scale is the quiet multiplier. A photo-built model has no size of its own; it gets one from LiDAR, from the phone’s motion tracking, from ground control points or from two cones a known distance apart. Because volume grows with the cube of length, a 1% error in scale is a 3% error in volume. That is why photogrammetry and LiDAR end up working together on a phone, and why LiDAR narrows the range without being required.
4. Density and moisture
Volume becomes tons through density, and density is its own measurement with its own error. Wet material weighs 10–20% more than dry; grading and compaction move the figure too. Auditors who attend stockpile counts test the density factor as carefully as the volume. Use the supplier’s figure for their product, and when the pile has been rained on, say so in the report. The density table has ranges for the common materials.
5. Timing, movement and rehandle
The books say what was delivered and sold up to a date. The survey says what was on the ground on another date, often with a loader working between the two. Material rehandled from one pile to another, swell when it was dug and settling as it sat all open gaps between the two numbers that have nothing to do with the instrument. Measuring a still pile, and recording the date and time on the report, removes most of it; swell and shrink explains the rest.
Why two surveys of the same pile disagree
Drone operator Birdi’s reconciliation guide for mine and quarry operators lists the four usual suspects: survey measurement error, wrong density, base-surface definition, and the gap between survey dates and actual movement. Notice that only the first is about the scan. When two numbers for one pile differ, compare their bases and toes first, then their densities and dates, and only then their methods.
Published accuracy figures make more sense read this way. A 2020 Estonian University of Life Sciences study found drone photogrammetry within 4% of laser-scanned truth on every pile it tested, and the Texas DOT tested a phone photogrammetry app to within about 1.5% on piles under 100 cubic yards. Vendors such as Propeller put traditional ground surveys at ±5–10% and drones at ±1–2%, a claim worth reading as marketing. All of these assume the base was handled the same way in the test and in the reference.
| Error source | Typical size | How to control it |
|---|---|---|
| Base surface definition | Can exceed the method error; unbounded on a sloped or buried base | Decide the base before measuring, record it, reuse it |
| Toe and footprint | A few percent | Capture the toe all the way around; check and edit the border |
| Coverage and scale | 1% in scale is 3% in volume; gaps are missing slices | Close the loop, keep the whole pile in view, use LiDAR or control for scale |
| Density | 10–20% from moisture alone | Use the supplier’s figure, note wet piles, test the factor |
| Timing and movement | Whatever moved between dates | Measure a still pile, date the report, reconcile to one date |
| Shape assumption (tape and formula) | 15–30% | Measure the surface instead |
Sizes are typical, not limits. The first row is the one that most often explains a surprise.
How to narrow the range on your own piles
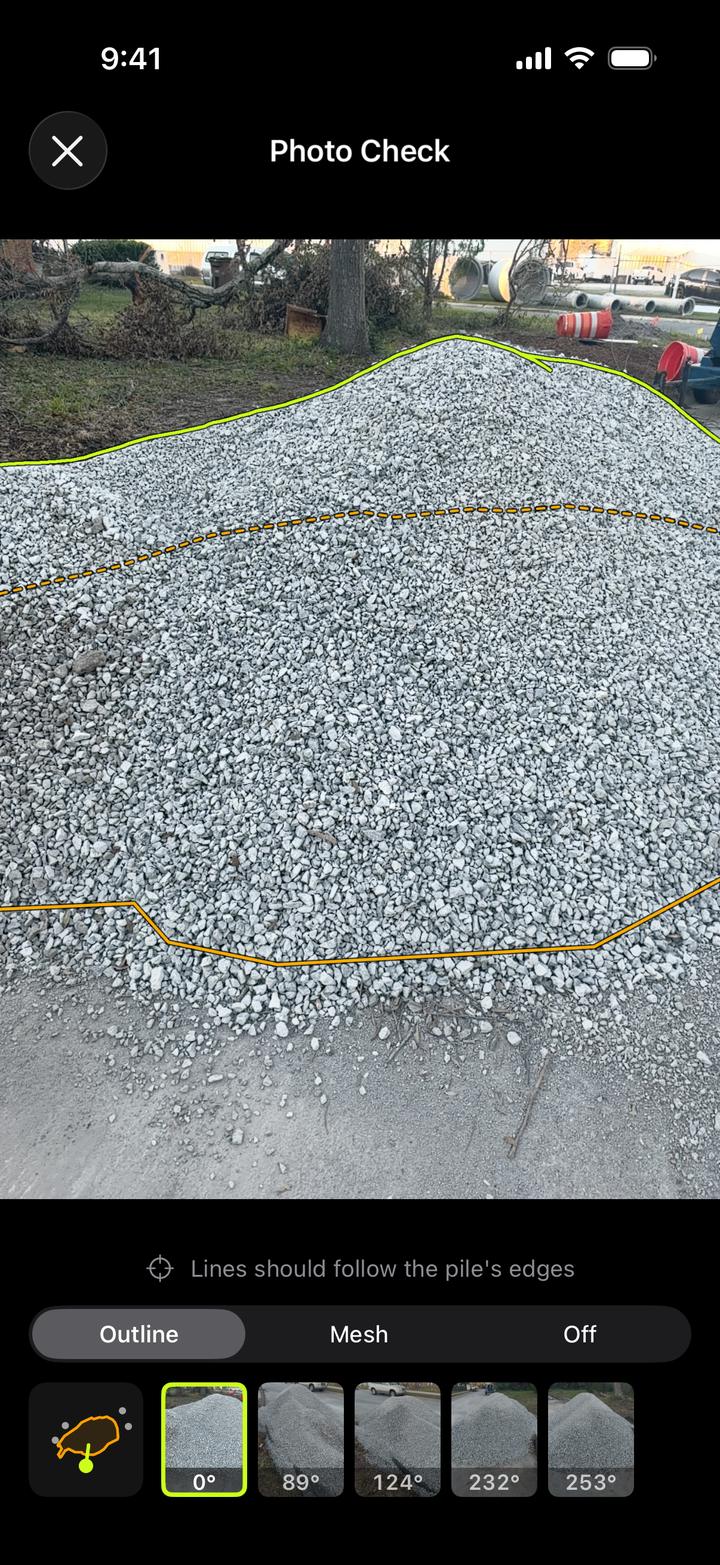
Scan the same pile twice and compare; the difference is a direct measure of your repeatability on that material. Scan a fresh delivery with a scale ticket and a known density; the difference is a direct measure of your accuracy. Look at the Photo Check overlay, which draws the measured shape over your own photos, and at the border, before you trust the number. Keep the PDF report, with its date, border, density and photos, because that is what turns a number into evidence six months later. The overview of how to measure a stockpile compares the methods, and the volume formula guide shows how far a cone can be from the real thing.
Frequently asked questions
How accurate are stockpile volume measurements?
Tape and cone estimates are typically within 15 to 30 percent. Drone photogrammetry lands within 4 percent of laser-scanned truth in published tests, and a state DOT test found a phone photogrammetry app within about 1.5 percent on piles under 100 cubic yards. All of these assume the base surface and toe were handled consistently.
What does the ± on a stockpile volume mean?
It is the range the measurement supports for that pile on that scan. A result of 12.1 cubic yards ±2.0 means the surface, scale and border are consistent with a volume between about 10 and 14 cubic yards. It is not a fixed accuracy for the app; a cleaner capture gives a narrower range.
Why do two surveys of the same stockpile give different volumes?
Usually because they used different base surfaces or toe lines, not because one instrument was wrong. Different density assumptions and different survey dates are the next most common causes. Compare bases and toes first, then density and dates, and only then the methods.
What is the biggest source of error in stockpile measurement?
The definition of the base under the pile. A pile on a slope, a crowned pad or old material can gain or lose more volume from the base assumption than from any difference between tape, drone, laser or phone. Density is the biggest source of error once volume becomes tons.
Measure your next pile with your iPhone
Stockpile Scan is free, with no ads, subscriptions or account. Every volume comes with a ± range worked out from that scan, plain-language checks, and a Photo Check overlay you can verify.
Any iPhone with iOS 18 or later. LiDAR optional. Learn more about the app.
Related articles
Sources and further reading
- LiDAR Magazine, Points & Pixels: why the base definition drives stockpile volume disputes
- GeoCue: Tips for defining stockpile toes
- Birdi: How to reconcile stockpile volumes, a guide for mine and quarry operators
- Propeller: How accurate is drone stockpile measurement?
- Kokamägi, Türk & Liba (2020): UAV photogrammetry for volume calculations, Agronomy Research
- ENR: TxDOT proves accuracy of stockpile volume measurement app